Revenue Analytics and Reports
The analytics pages turn your normalized revenue into decision-ready metrics: SaaS Metrics for recurring-revenue quality, Channel Performance for unit economics by channel, and Financial Reports for the standard finance report library.
Overview
Under Analytics in the Revenue page’s section rail:
- SaaS Metrics — ARR, MRR, retention, and the ARR waterfall.
- Channel Performance — revenue, mix, and margin by channel.
- Financial Reports — libraries of billing and bank-reconciliation reports you can run and export.
SaaS Metrics
The SaaS Metrics dashboard summarizes recurring-revenue health across the selected channel and date range. One exception: retention (NRR and GRR) is measured over the trailing twelve months ending at the selected end date, so the selected start date does not move it.
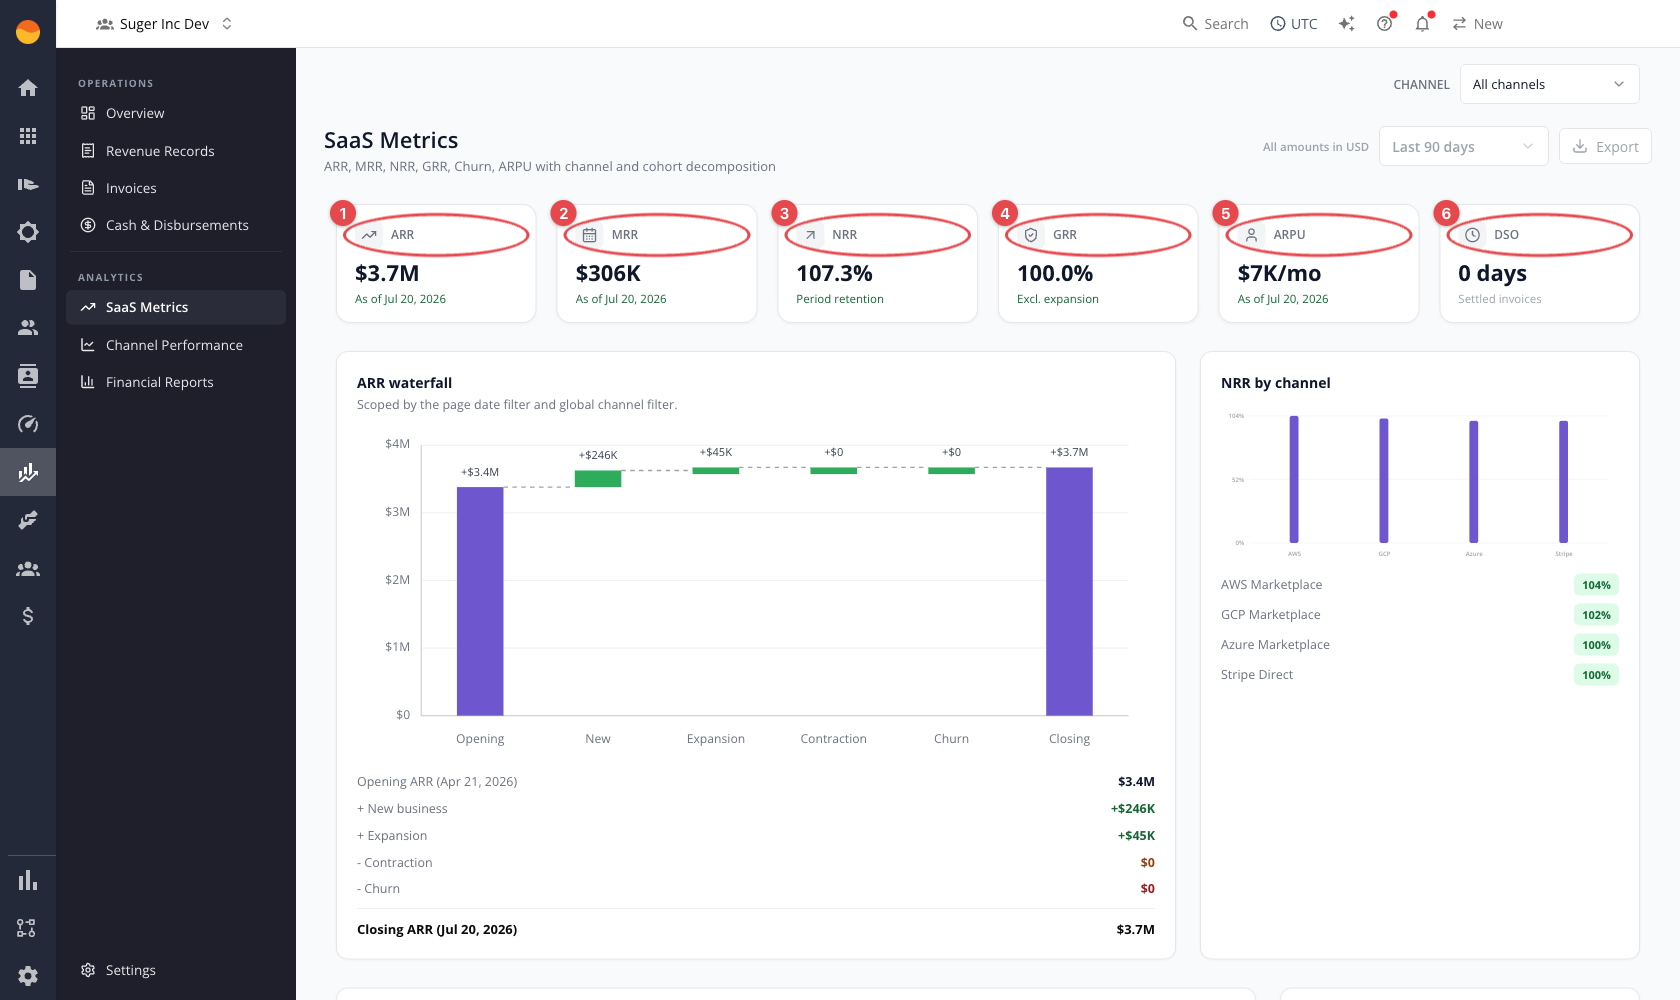
Metric cards
| Card | Meaning |
|---|---|
| ARR | Annual Recurring Revenue — the annualized value of the subscription revenue active at the end of the period. |
| MRR | Monthly Recurring Revenue for the same active recurring base. |
| NRR | Net Revenue Retention — how much of the recurring revenue active twelve months earlier is still active, plus expansion. |
| GRR | Gross Revenue Retention — retention before expansion. |
| ARPU | Average revenue per customer, per month — MRR divided by the customers with an active subscription record. |
Each card carries an in-product tooltip with its definition — hover its info icon.

The five metric cards, circled left to right: ① ARR, ② MRR, ③ NRR, ④ GRR, and ⑤ ARPU. ARR/MRR/ARPU carry an As of <date> snapshot label; NRR/GRR show the retention basis. DSO is not a SaaS Metrics card — it lives only on Invoices, with your accounts receivable.
Charts include the ARR waterfall (opening → new → expansion → contraction → churn → closing), NRR by channel (channels with recurring revenue at the end date), an MRR trend (total MRR for each of the twelve months ending at the end date; its New, Expansion, and Churned MRR series currently read zero), and ARPU by channel. Export downloads the five headline metrics — ARR, MRR, NRR, GRR, and ARPU — as CSV. A chart with nothing to show says so — for example, No channel NRR data to display.
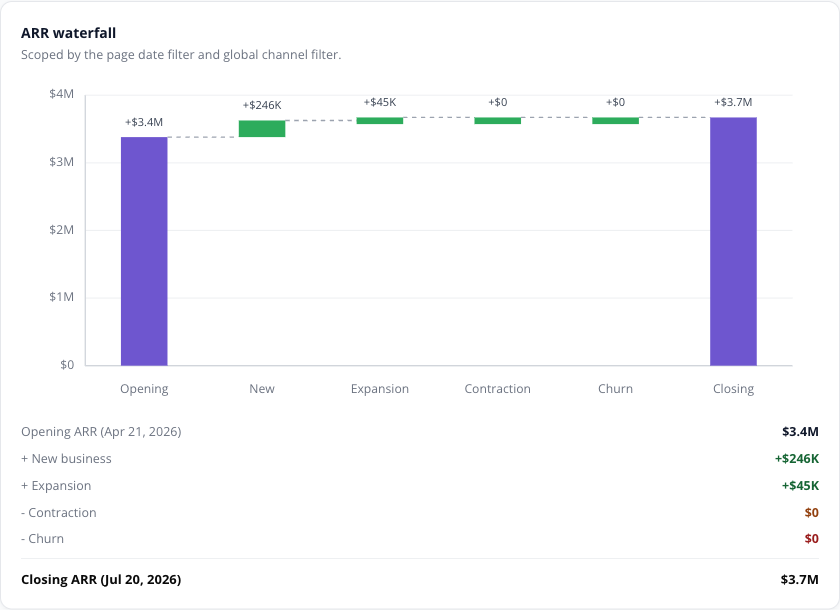
The waterfall reads left to right — Opening ARR plus New business and Expansion, minus Contraction and Churn, equals Closing ARR — with the running reconciliation listed beneath the bars. New business includes customers who come back after lapsing; Expansion and Contraction currently read zero (see the caution above).
Channel Performance
The Channel Performance page compares revenue and unit economics across channels for the revenue records invoiced in the selected date range — a record with no invoice date is left out, except under All time. The workspace Channel filter still shows in the page’s title row, but it does not narrow this page.
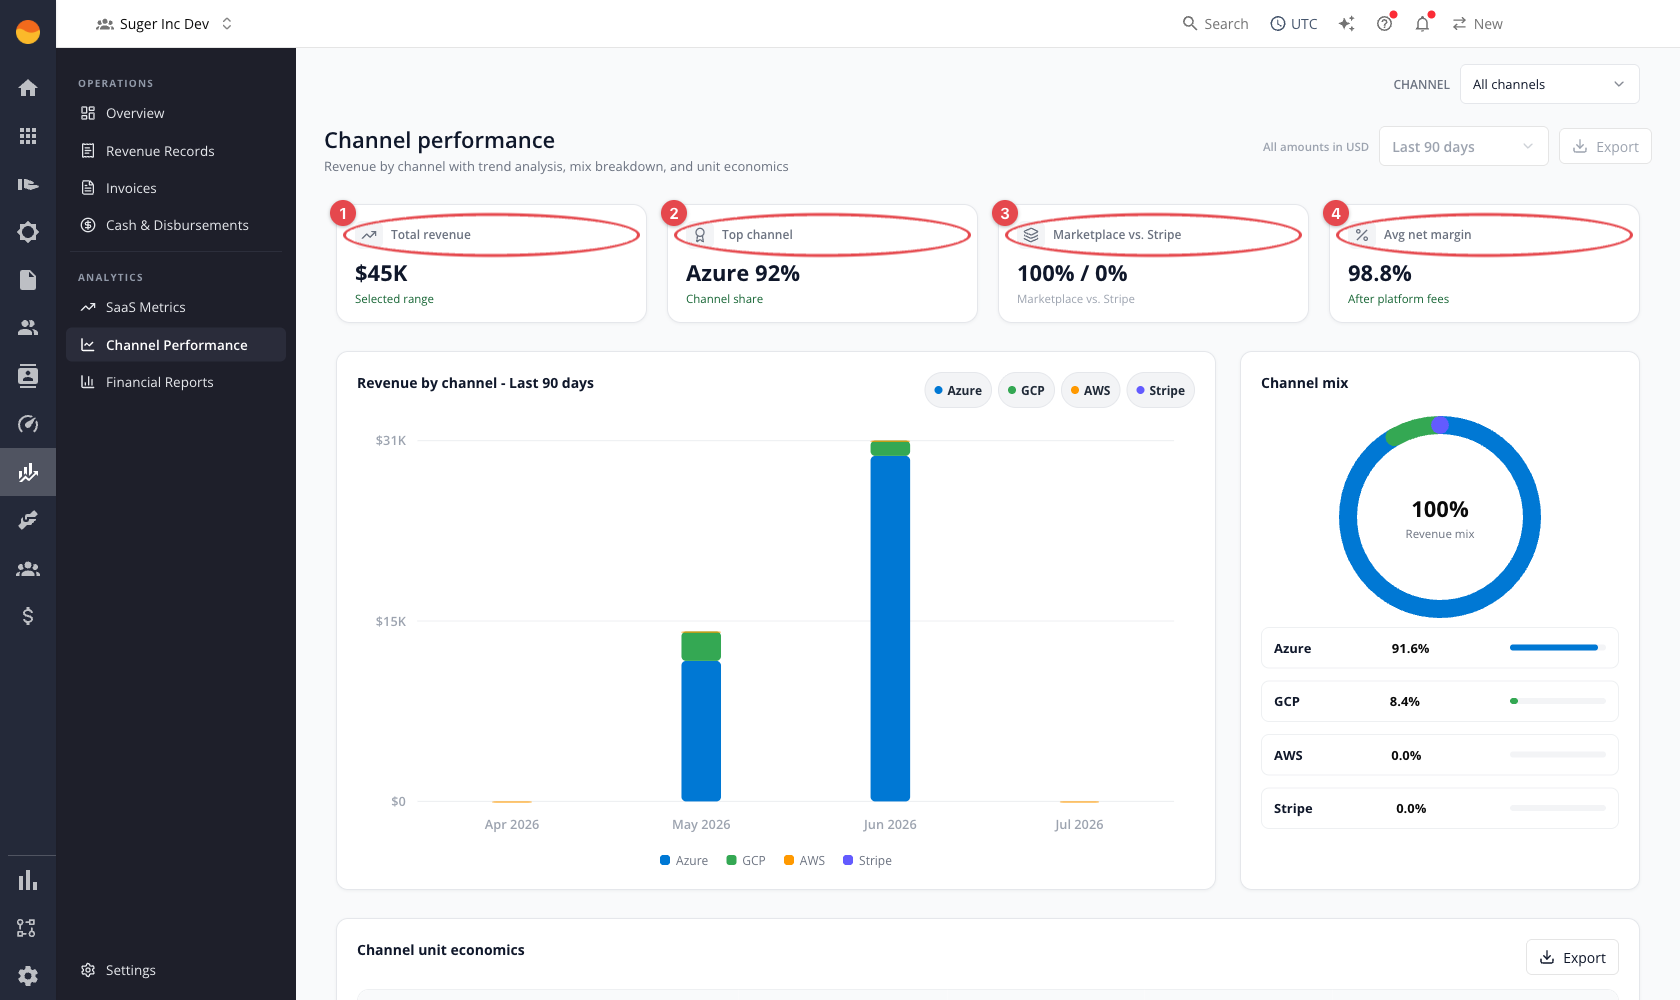
Metric cards
| Card | Meaning |
|---|---|
| Total revenue | Total revenue across all channels in scope. |
| Top channel | The highest-revenue channel and its share. |
| Marketplace vs. Stripe | Split of revenue between marketplace channels and Stripe. |
| Avg net margin | Average net margin after platform fees. |

Circled left to right: ① Total revenue, ② Top channel and its share, ③ Marketplace vs. Stripe split, and ④ Avg net margin after platform fees.
A revenue by channel bar chart and a channel mix donut visualize the split, and the channel unit economics table lists each channel’s revenue, platform fee, net revenue, net margin, and average days to payout. Use Export on the page header or above the table to download the data to CSV.
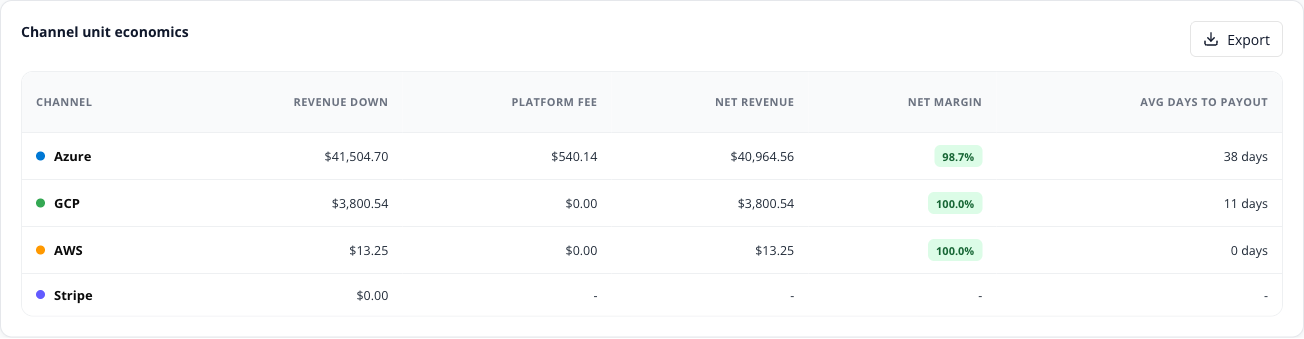
Each row is one channel; compare net margin and avg days to payout across AWS, Azure, GCP, and Stripe to see which channel keeps the most of every dollar and pays out fastest.
How the channel figures are built
Every column on this page is derived from the revenue records in scope, per channel:
- Gross revenue (the table’s revenue column and the Total revenue card) = the sum of positive invoice amounts, in USD.
- Net revenue = gross revenue − channel fees − refunds, where refunds are the refund amounts recorded on the records, whatever the refund’s status.
- Net margin (the table’s margin column) = net revenue ÷ gross revenue × 100.
- Average settlement days = the mean of (disburse date − invoice date) across records that have both dates. A record whose disburse date falls before its invoice date is excluded from the average entirely — it is dropped from both the total and the count, not counted as zero.
Financial Reports
The Financial Reports page holds two libraries of standard reports you can run on demand: Billing reports and Bank reconciliation reports.
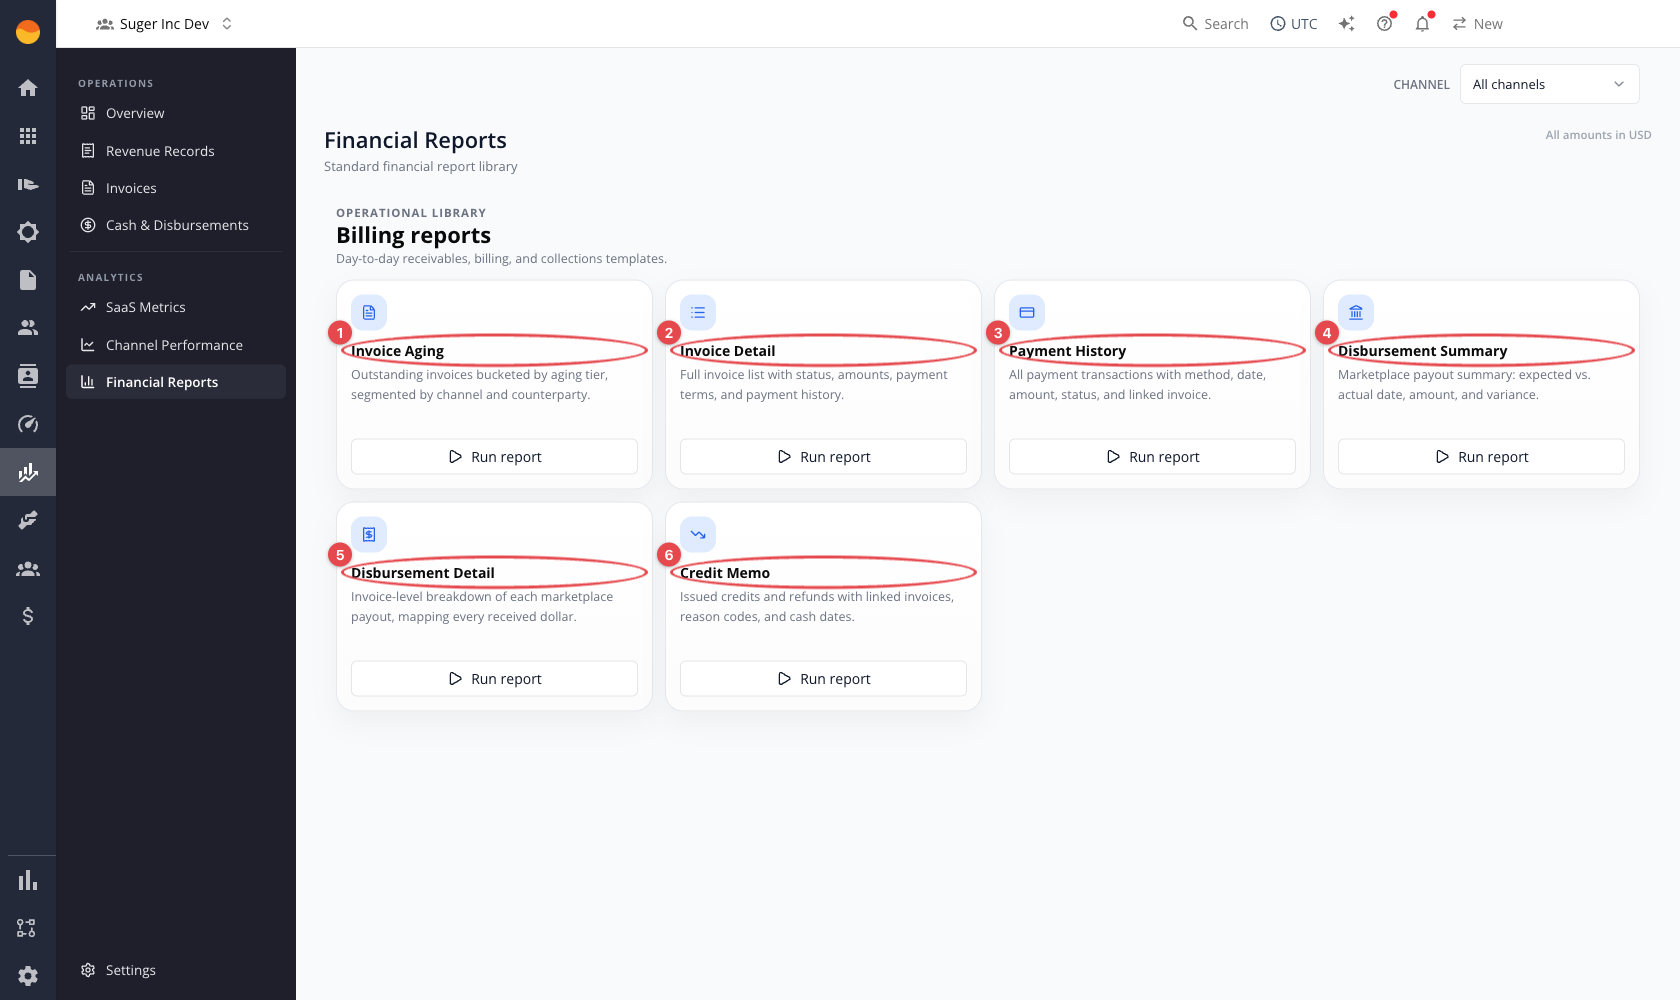
The Billing reports library covers day-to-day receivables, billing, and collections — the six reports are circled above (① Invoice Aging, ② Invoice Detail, ③ Stripe Payout Report, ④ Disbursement Summary, ⑤ Disbursement Detail, ⑥ Credit Memo):
- Invoice Aging — outstanding invoices bucketed by aging tier, segmented by channel and counterparty.
- Invoice Detail — full invoice list with status, amounts, payment terms, and payment history.
- Stripe Payout Report — Stripe payouts with method, date, amount, status, and linked invoice.
- Disbursement Summary — marketplace payout summary: expected vs. actual date, amount, and variance.
- Disbursement Detail — invoice-level breakdown of each marketplace payout, mapping every received dollar.
- Credit Memo — issued credits and refunds with linked invoices, reason codes, and cash dates.
The Bank reconciliation reports library covers bank transaction matching and variance review. It holds one report:
- Bank Reconciliation Detail — bank transactions with match details, buyers, invoices, and CRM opportunities.
It has one row per imported bank transaction — pending, voided, and inactive transactions are left out — in no particular order: unmatched transactions are not listed first. A few things to know when you read it:
- The date range filters on the Transaction Date. The channel filter uses the channel of the transaction’s first match, so unmatched transactions drop out as soon as you choose a channel.
- Only a transaction’s first match is reported, even when one deposit matched several records: Buyer, Invoice IDs, Revenue Record, Revenue Record ID, Invoice #, Channel, Marketplace Counterparty, Payout / Disbursement Ref, and Payout Amount (USD) all describe that match, and Customer shows its buyer ID.
- CRM Opportunity and CRM Source are currently blank.
- Match Method and Match Status show Fours’ match codes (for example,
RULE_MATCHED). Matched By names the reviewer and is blank for a match nobody reviewed. - Bank amounts and variances in another currency are shown with the exchange rate and date Fours used, from its latest daily exchange-rate snapshot.
Run and export a report
- Select Run report on the report you want (for example, Disbursement Detail).
- In the report modal, adjust the date range and channel in the header to scope the preview. A custom date range is not applied as you pick the dates — select Apply to run it.
- Review the preview — the first 10 rows — and the generated row count.
- Select CSV or PDF to export, or Cancel/Close to dismiss. Both exports include every row, not just the preview.
Every report reads your organization’s records before it applies the date and channel filters, and stops with report source exceeds 10000 rows; narrow the date or channel filters once that source passes 10,000 rows — because the limit counts records before the filters, narrowing them does not help. A PDF that takes longer than 20 seconds to build, or would be larger than 10 MiB, also fails; export CSV instead.
Disbursement Summary and Disbursement Detail cover marketplace payouts only. Their channel selector filters on each row’s Marketplace, so AWS, Azure, or GCP narrows them to that marketplace, while Stripe or Direct returns no rows — Stripe payouts are in Stripe Payout Report.
Choose Disbursement Detail columns
Disbursement Detail is the one report whose columns you choose. Its card carries a column chooser — the settings icon beside Run report:
- Select the column chooser on the Disbursement Detail card.
- Check the columns you want, and clear the rest.
- Select Run report. The preview, the CSV, and the PDF all use your selection.
All 18 standard columns start selected. Reseller ID and Reseller Name start cleared, and are offered only if your organization has AWS or GCP revenue records; they currently come out empty even when selected. Your selection is saved in this browser for your organization, and the columns always appear in the report’s standard order. Run report stays disabled while no column is selected.
Columns you will see across the reports
| Column | What it carries |
|---|---|
| Buyer ID and Buyer Name | The buyer, as two separate columns rather than one combined field. On Invoice Aging, an invoice stored without a buyer shows the buyer of its matching revenue record. |
| Marketplace Counterparty | The marketplace that owes you the receivable: it names the marketplace (for example AWS) when the marketplace operator owes it, and is blank when the end buyer or a channel partner (a reseller) does. A row with no counterparty type shows the counterparty stored with it, if any. |
| Payment Terms | On Invoice Aging and Invoice Detail, Net N days: the net terms stored on the invoice, else the whole days from its invoice date to its due date. |
| Is Estimated | Flags a GCP row with no disburse date, whose figures rest on its expected payout rather than a confirmed one. |
| Marketplace Fee VAT | The VAT a marketplace charged on its own fee, broken out from the fee itself. |
| Disbursed Amount | What was actually paid out. Replaces the older single Net Amount column, which conflated the two. |
| CRM Opp ID | On Disbursement Detail, the Salesforce opportunity id — else the HubSpot deal id — taken from the entitlement metadata, then the offer metadata, and finally the CRM opportunity id stored on the record. |
| Offer ID | On Disbursement Detail, the offer of the record’s entitlement — or, when the record has no entitlement or its entitlement carries no offer, the offer on the channel’s own record. |
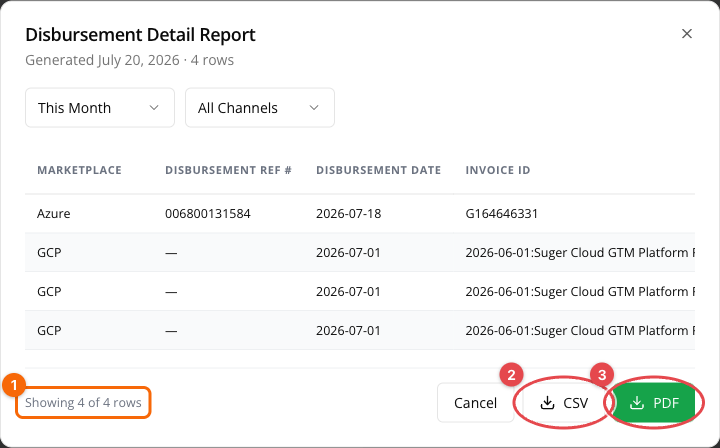
The modal footer shows the ① generated row count for the current scope, with ② CSV and ③ PDF export beside it.
KPI calculation formulas
The two analytics pages do not share a basis. SaaS Metrics is computed from subscription revenue records, each annualized over its service or billing period; Channel Performance is computed from every revenue record invoiced in the range. Read them as two different lenses on the business, not as two views of one number.
| KPI | Applies to | Formula | Calculation details |
|---|---|---|---|
| ARR | AWS, Azure, GCP, Oracle (records marked subscription-based; never Stripe) | Σ annualized value of subscription records active at the period end | Annualized value = the record’s USD amount × 12 ÷ the months in its service or billing period. |
| MRR | Same as ARR | ARR ÷ 12 | Derived from the same active recurring base. |
| NRR | Same as ARR | (base + expansion − contraction − churn) ÷ base × 100 | Base = the ARR of the records active twelve months before the selected end date. Each record is compared only with itself, so expansion and contraction are zero and NRR equals GRR. The selected start date does not shift this base. |
| GRR | Same as ARR | (base − contraction − churn) ÷ base × 100 | Retention before expansion, on the same trailing-twelve-month base. |
| Churn (waterfall) | Same as ARR | Σ ARR of records active at the start of the range and no longer active at its end | Shown as an amount in the ARR waterfall, over the selected range. |
| ARPU | Same as ARR | MRR ÷ distinct buyers with an active subscription record | Per month. |
| ARR waterfall — Opening / Closing ARR | Same as ARR | Σ annualized value of records active just before the range starts / … active at its end | Over the selected range, not the trailing twelve months. |
| ARR waterfall — New business | Same as ARR | Σ ARR of records active at the end of the range that were not active before it | Includes customers who come back after lapsing. |
| ARR waterfall — Expansion / Contraction | Same as ARR | always 0 | Each record is compared only with itself, so neither can occur. |
| NRR by channel | Same as ARR | the NRR formula, per channel | Only channels with recurring revenue at the end date appear. |
| ARPU by channel | Same as ARR | channel ARR ÷ 12 ÷ distinct buyers active in that channel | Per month. |
| MRR trend | Same as ARR | Σ annualized value of active records ÷ 12, at the end date and at each of the eleven monthly steps back from it | The Total MRR series; the New, Expansion, and Churned MRR series are always zero. |
| Total revenue | AWS, Azure, GCP, Stripe | Σ positive invoice amounts in USD, across channels in scope | From revenue records invoiced in the range. |
| Top channel share | AWS, Azure, GCP, Stripe | channel revenue ÷ total revenue | Highest-revenue channel. |
| Channel mix | AWS, Azure, GCP, Stripe | channel gross revenue ÷ total revenue × 100 | The same gross revenue as the table. |
| Revenue by channel (chart) | AWS, Azure, GCP, Stripe | Σ revenue per channel per month | Each record counts its USD base amount, else its first non-zero invoice, collectable, or disbursed amount in USD, in the month of its invoice date (falling back to service start, billing-period start, provider update, or last update) — before refunds, so the bars need not add up to the table’s gross revenue. |
| Marketplace vs. Stripe | AWS, Azure, GCP, Stripe | (AWS + Azure + GCP revenue) ÷ total revenue and Stripe revenue ÷ total revenue | Two percentages of the same total. Other channels in your data count toward the total only, so the two can add up to less than 100%. |
| Net revenue | AWS, Azure, GCP, Stripe | gross revenue − channel fees − refunds | Refunds = the refund amounts recorded on the records, whatever the refund’s status. (Platform fee is this page’s label for the channel fee.) |
| Net margin | AWS, Azure, GCP, Stripe | net revenue ÷ gross revenue × 100 | The per-channel Net margin column in the unit-economics table. Despite the column name, the ratio is net revenue over gross revenue. |
| Avg net margin | AWS, Azure, GCP, Stripe | Σ net revenue ÷ Σ gross revenue (over channels whose fee data is complete) | A channel counts only when every invoice in the range carries a usable fee. |
| Avg net margin — fee availability | GCP | a stored fee of zero counts as a real fee | GCP derives its fee from every usage row, so zero is authoritative. |
| Avg net margin — fee availability | AWS, Azure, Stripe | a fee must be above zero | A zero is treated as “fee data not yet ingested”, which is why the card can read Run a full sync to load platform fees. |
| Avg days to payout | AWS, Azure, Stripe | mean(disburse date − invoice date), in whole days | Across records that have both dates. A record whose disburse date precedes its invoice date is excluded from both the total and the count — it is not floored to zero. A channel with no such records shows 0 days. |
| Avg days to payout | GCP | always 0 days | GCP records carry no disburse date, so GCP never contributes. |
| Revenue in USD (all Channel Performance columns) | AWS, Azure, GCP, Stripe | amount × the record's locked source-to-USD projection | A USD record passes through 1:1. A non-USD record with no valid stored projection contributes zero, rather than being counted as though its amount were already dollars. |
The Financial Reports page has no summary KPIs of its own.
Spotted something wrong or out of date on this page? Tell us and we'll correct it.